Weather Analysis
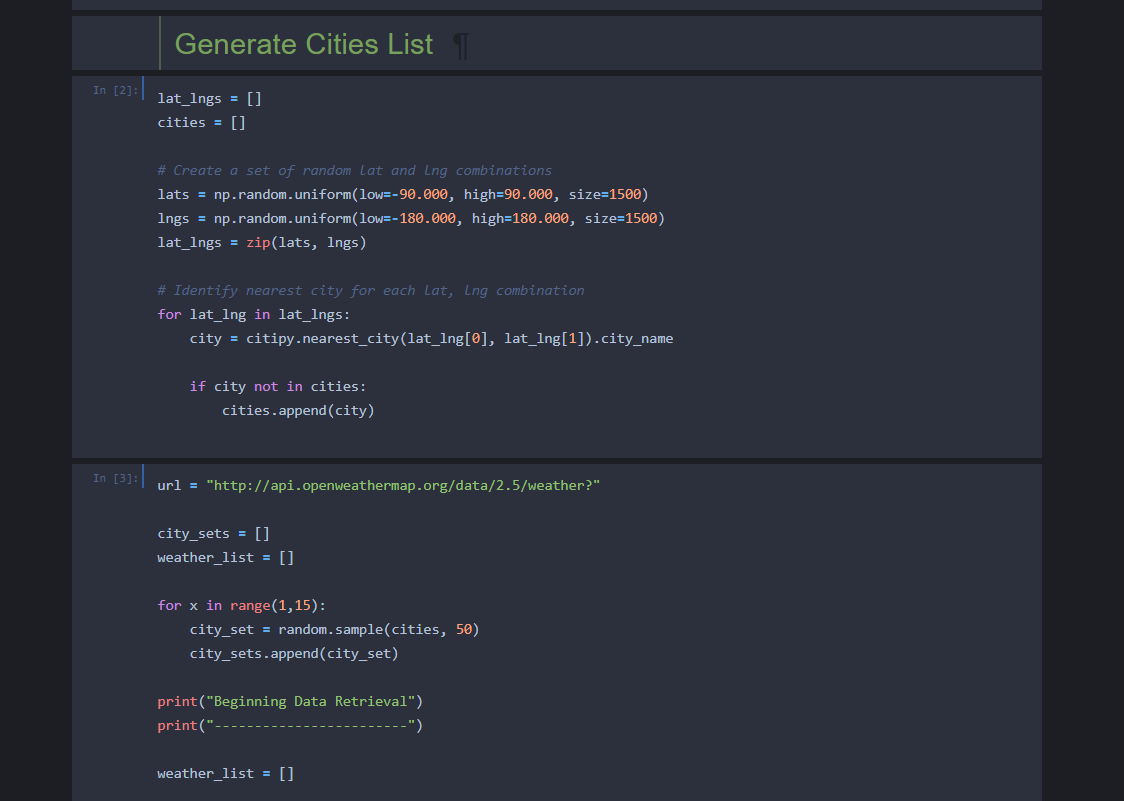
A list of over 1000 different cities was generated using random numbers as latitudinal and longitudinal coordinates to ensure random selection of cities throughout the world. After the lists were created and combined, the coordinates were run through CitiPy to find the nearest known city to those coordinates. Finally, the cities were placed in an API call that got weather data for the 1000+ cities, and that data was placed into a dataframe where analysis could be performed.
RANDOM NUMBER GENERATION FOR COORDINATES AND CITIPY
API CALL TO OPEN WEATHER DATA
DATAFRAME GENERATION
ANALYSIS
As we can see, temperature does increase as you get further away from the equator, with many of the hottest points appearing around the +30th parallel.
Humidity doesn’t seem to change too drastically with distance from the equator, but there does seem to be some high-humidity clustering around the +60th parallel.
Wind speed doesn’t seem to be affected by distance from the equator.
Cloudiness is unaffected as well.
Conclusion: While temperature may be affected by distance from the equator, other weather related measurements don’t seem to be. The higher temperatures between the 20th and 40th parallel in the northern hemisphere could be due to the Earth’s tilt at a 23.5 degree angle towards the sun at the time of measurement (summer in the northern hemisphere).
Also, it should be noted that there are very few temperature recordings below the -50th parallel because there are no cities close to Antarctica, and the weather was collected based upon what cities were closest to random coordinates.


